 AI Knowledge Tree
Random variables and distributions
Define random variables, their CDF, and the PMF/PDF, and tell discrete from continuous.
A probability space tells you which outcomes are possible and how likely each event is, but outcomes are often unwieldy objects (a card, a coin face, a point in space). A random variable attaches a number to each outcome, turning probability into something we can average, plot, and compute with.
Definition
A random variable is a function that assigns a real number to each outcome[1]. For a die, is the face value; for two coins, could count the number of heads.
The probability of landing in a set is the probability of the outcomes that map into :
The right-hand side is a probability of an event in the original space; the left-hand side is the notation we actually use. The distribution of is the collection of these probabilities over all .
The cumulative distribution function
The cumulative distribution function (CDF) of is[2]
It works for any random variable, discrete or continuous. Three properties follow directly from the probability axioms:
- Monotone nondecreasing: if then , so by monotonicity of .
- Limits: as and as .
- Right-continuous.
Any function with these properties is the CDF of some random variable.
Discrete random variables and the PMF
is discrete if it takes values in a finite or countable set. Its distribution is captured by the probability mass function (PMF)
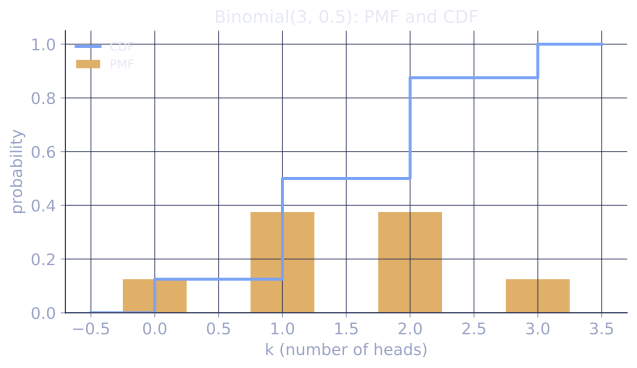
The CDF is a sum of masses: , a staircase that jumps by at each value .
Continuous random variables and the PDF
is continuous if its CDF can be written as an integral
for some nonnegative probability density function (PDF) . By the fundamental theorem of calculus, where the derivative exists.
A density is not a probability: can exceed 1. Probabilities come from integrating it over an interval,
and a single point has probability zero, . The normalization is .
The density as a limit
The interpretation of is a probability per unit length: for a small width ,
So measures how concentrated the probability is near , just as mass density measures how concentrated matter is near a point.
Check it on arrays
Sampling lets us reconstruct both the PMF (by counting) and the PDF (by a normalized histogram), and verify that the empirical CDF tracks the theoretical one.
import numpy as np

rng = np.random.default_rng(1)
N = 200_000

# Discrete: number of heads in 3 fair coin flips -> values 0..3
flips = rng.integers(0, 2, size=(N, 3))
X = flips.sum(axis=1)
values, counts = np.unique(X, return_counts=True)
pmf = counts / N
# Exact PMF: C(3,k)/8
from math import comb
exact = np.array([comb(3, k) for k in values]) / 8
for v, p, e in zip(values, pmf, exact):
    print(f"P(X={v}) = {p:.4f}   exact {e:.4f}")
print("PMF sums to:", pmf.sum())

# Continuous: standard normal, compare histogram to the PDF
Z = rng.normal(size=N)
hist, edges = np.histogram(Z, bins=50, density=True)   # density=True -> integrates to 1
centers = 0.5 * (edges[:-1] + edges[1:])
pdf = np.exp(-centers**2 / 2) / np.sqrt(2 * np.pi)
print("max |hist - pdf|:", np.max(np.abs(hist - pdf)))   # small

# Empirical CDF at 0 should be ~0.5
print("F_Z(0) empirical:", (Z <= 0).mean(), "  theoretical 0.5")
Counting recovers the binomial PMF, the normalized histogram matches the Gaussian density, and the empirical CDF lands on the theoretical value.
Exercises
Exercise 1. A discrete random variable has PMF , , . Write its CDF as a staircase and evaluate and .
Solution
Step 1. The CDF accumulates mass from the left:
Step 2. Read off .
Step 3. For the interval, use . This counts the mass at and but excludes the mass at , matching .
Exercise 2. A continuous random variable has density for and elsewhere. Confirm it is a valid density, find the CDF, and compute .
Solution
Step 1. Validity needs nonnegativity (true since on ) and total integral :
Step 2. The CDF is the running integral, for :
with below and above .
Step 3. Evaluate . Less mass sits below the midpoint than above it, as expected from a density that grows with .
Exercise 3 (code). Sample from the density on by inverse transform: if is uniform on , then has CDF . Verify the empirical CDF at matches the theoretical .
Solution
import numpy as np

rng = np.random.default_rng(4)
N = 500_000
U = rng.random(N)
X = np.sqrt(U)                      # inverse of CDF F(x) = x^2 on [0, 1]

emp_cdf_half = (X <= 0.5).mean()    # should approach F(0.5) = 0.25
theoretical = 0.5**2

assert np.isclose(emp_cdf_half, theoretical, atol=2e-3)
print("F_X(0.5) empirical:", round(emp_cdf_half, 4),
      " theoretical:", theoretical)
Inverting the CDF turns uniform draws into samples from , and the empirical CDF at lands on the theoretical to sampling precision.
The next lesson collapses a whole distribution into a single representative number: its expectation.
References
- [1]Wasserman, L. (2004). All of Statistics. Springer. Ch. 2, random variables and distribution functions. doi:10.1007/978-0-387-21736-9↩
- [2]Casella, G., & Berger, R. L. (2002). Statistical Inference (2nd ed.). Duxbury. §1.5-1.6, CDFs and density/mass functions.↩