 AI Knowledge Tree
Transformations of random variables
Push a distribution through a function with the change-of-variables formula.
You often know the distribution of but need the distribution of : sampling a uniform and turning it into a Gaussian, or pushing a latent variable through a neural network in a normalizing flow. The change-of-variables formula tells you exactly how a density transforms, and the determinant from linear algebra reappears as the local volume-stretching factor.
The CDF route (always works)
The safe, general method is to compute the CDF of and differentiate. For an increasing ,
Differentiating with the chain rule gives the density. This route handles non-monotone too, by splitting into monotone pieces.
The change-of-variables formula (1D)
For a differentiable, strictly monotone with inverse , differentiating [1]:
The absolute value covers decreasing (where , and the derivative is negative). The factor corrects for how stretches or compresses the axis: where spreads probability over a wider range, the density thins out.
A useful restatement uses :
Probability mass is conserved, ; only its density per unit length changes.
The multivariate formula
For an invertible differentiable map on , the single derivative becomes the Jacobian determinant[2]:
where is the Jacobian matrix of the inverse map. The determinant is the local volume-scaling factor of the transformation (its meaning from linear algebra), now applied pointwise to a nonlinear map. This is the identity normalizing flows exploit: stack invertible maps with cheap log-determinants to build a flexible density whose normalization stays tractable.
Worked example: inverse-CDF sampling
If and is a target CDF, then has CDF . Check it:
using that is increasing and is uniform on (so ). This is how a single uniform random source generates samples from any distribution with an invertible CDF, for example the exponential via .
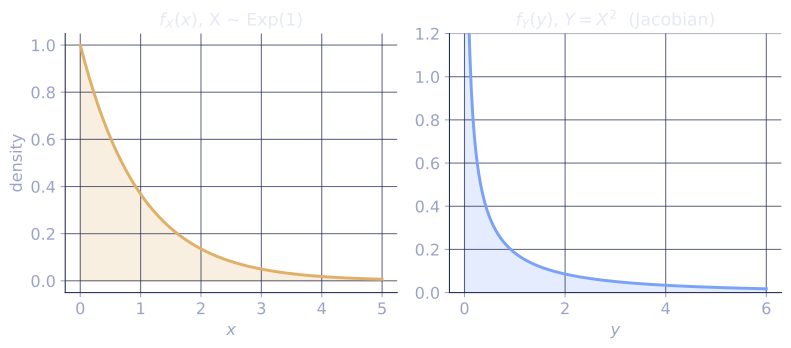
Check it on arrays
import numpy as np

rng = np.random.default_rng(8)
N = 1_000_000

# Inverse-CDF sampling for Exponential(rate=lambda): X = -ln(1-U)/lambda
lam = 1.5
U = rng.random(N)
X = -np.log(1 - U) / lam
print("inverse-CDF exp mean:", round(X.mean(), 4), "  exact 1/lambda =", round(1/lam, 4))
print("numpy exp mean:      ", round(rng.exponential(1/lam, N).mean(), 4))

# Change of variables: Y = X^2 for X ~ N(0,1); density check via histogram
Xn = rng.normal(size=N)
Y = Xn**2                                   # chi-square with 1 dof
hist, edges = np.histogram(Y, bins=200, range=(0.01, 5), density=True)
centers = 0.5 * (edges[:-1] + edges[1:])
# f_Y(y) = f_X(sqrt y)/|g'(x)| summed over the two roots +/-sqrt(y):
#        = 2 * phi(sqrt y) * (1/(2 sqrt y)) = phi(sqrt y)/sqrt y
phi = lambda x: np.exp(-x**2/2)/np.sqrt(2*np.pi)
f_theory = phi(np.sqrt(centers)) / np.sqrt(centers)
print("max |hist - theory|:", round(np.max(np.abs(hist - f_theory)), 4))
Inverse-CDF sampling reproduces the exponential mean, and the analytic density of (with the Jacobian factor and both roots accounted for) matches its histogram.
Exercises
Exercise 1. Let and . Use the 1D change-of-variables formula to find the density and name the resulting distribution.
Solution
Step 1. The map is strictly decreasing on , with inverse for . Its derivative is .
Step 2. Apply . On the uniform density is , so
This is the Exponential(1) density. Taking the negative log of a uniform is the inverse-CDF recipe for the rate-1 exponential, matching from the lesson at (with and both uniform on ).
Exercise 2. Let have density and let with , an affine transform. Derive and confirm it specializes correctly: a Gaussian maps to .
Solution
Step 1. Invert: , with constant derivative . The formula gives
The is the Jacobian: stretching the axis by thins the density by the same factor so total mass stays one.
Step 2. Substitute the Gaussian density. With ,
Step 3. Rewrite the exponent. Since , its square over is , and the prefactor . So
the density of .
Exercise 3 (code). Verify Exercise 1 numerically: transform a million uniform samples by and confirm the empirical histogram matches the Exponential(1) density .
Solution
import numpy as np

rng = np.random.default_rng(0)
N = 1_000_000

X = rng.random(N)
Y = -np.log(X)

hist, edges = np.histogram(Y, bins=200, range=(0.0, 6.0), density=True)
centers = 0.5 * (edges[:-1] + edges[1:])
f_theory = np.exp(-centers)        # Exponential(1) density

max_err = np.max(np.abs(hist - f_theory))
print("mean of Y:", round(Y.mean(), 4), " exact 1.0")
print("max |hist - theory|:", round(max_err, 4))
assert np.isclose(Y.mean(), 1.0, atol=1e-2)
assert max_err < 0.02
The transformed samples have mean near 1 (the Exponential(1) mean) and their histogram tracks , confirming the derived density.
The next lesson steps back from exact distributions to bounds that hold for all of them: the basic probability inequalities.
References
- [1]Casella, G., & Berger, R. L. (2002). Statistical Inference (2nd ed.). Duxbury. §2.1, distributions of functions of a random variable.↩
- [2]Wasserman, L. (2004). All of Statistics. Springer. §2.7-2.8, transformations of random variables and the multivariate Jacobian. doi:10.1007/978-0-387-21736-9↩