 AI Knowledge Tree
Expectation and the law of the unconscious statistician
Define expectation, prove linearity, and compute E[g(X)] without first finding the distribution of g(X).
A distribution carries a lot of detail. Often the single most useful summary is its center of mass: the value the random variable takes on average over many trials. That is the expectation, and its single most useful property, linearity, holds with no independence assumptions at all.
Definition
The expectation (or mean) of a random variable is a probability-weighted average of its values[1]. For a discrete with PMF ,
and for a continuous with PDF ,
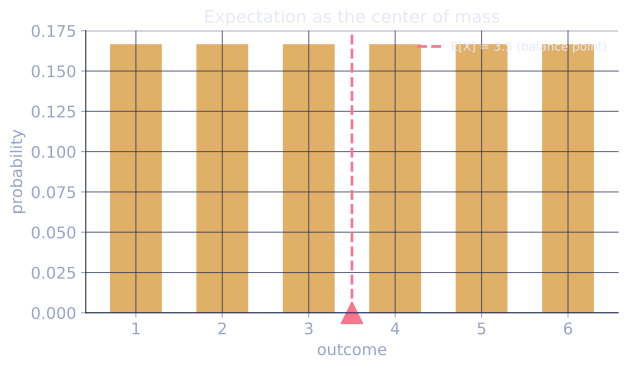
whenever the sum or integral converges absolutely. The expectation is a single number, often written . It is the balance point of the distribution: the place where the PMF or PDF would balance on a knife edge.
The law of the unconscious statistician
To compute the expectation of for some function , one route is to find the distribution of the new random variable , then average. The law of the unconscious statistician (LOTUS) says you can skip that step and weight by the distribution of directly[2]:
Why it holds (discrete case). Group the outcomes by the value that takes:
The inner step replaces by , valid because the sum only includes with . Summing over the groups recovers a sum over all .
Linearity of expectation
For any random variables and constants ,
Derivation (discrete, joint PMF ). By LOTUS applied to the function ,
The first double sum marginalizes out to give ; the second gives . So the expectation of a sum is the sum of expectations, with no independence assumption. This is what makes linearity so powerful: it applies even to highly dependent variables.
A worked use of linearity
How many heads in flips of a coin with ? Let be the indicator that flip is heads, so . The total is , and by linearity
with no need to touch the binomial PMF. Indicator random variables plus linearity solve a large fraction of counting-expectation problems.
Check it on arrays
import numpy as np

rng = np.random.default_rng(2)
N = 500_000

# E[X] for a die
X = rng.integers(1, 7, size=N)
print("E[die]:", X.mean(), "  exact 3.5")

# LOTUS: E[X^2] computed by weighting g(x)=x^2, no distribution of X^2 needed
print("E[X^2]:", (X**2).mean(), "  exact", sum(x**2 for x in range(1, 7)) / 6)

# Linearity without independence: Y = X, so X + Y = 2X are perfectly dependent
Y = X
print("E[X + Y]:", (X + Y).mean(), "  E[X]+E[Y]:", X.mean() + Y.mean())

# Indicators + linearity: heads in n=10 flips, q=0.3
q, n = 0.3, 10
flips = (rng.random(size=(N, n)) < q)
total = flips.sum(axis=1)
print("E[heads]:", total.mean(), "  n*q:", n * q)
The die mean lands on 3.5, LOTUS gives the right second moment, linearity holds even for the perfectly dependent pair, and the indicator sum averages to .
Exercises
Exercise 1. A fair six-sided die is rolled once. Use LOTUS to compute directly, without finding the distribution of .
Solution
Step 1. LOTUS weights by the PMF of , which is for each :
Step 2. Sum the squares and divide:
Computing the distribution of (values , each with probability ) gives the same sum; LOTUS skips that bookkeeping.
Exercise 2. Draw a card position uniformly: a hat holds cards numbered to , you draw all in random order. Let be the number of cards that land in their own position (a "fixed point"). Use indicator variables and linearity to show for every .
Solution
Step 1. Define indicators. Let if card lands in position , and otherwise. Then .
Step 2. Each card is equally likely to land in any of the positions, so , giving .
Step 3. Apply linearity (the are dependent, but linearity needs no independence):
On average exactly one card matches its position, regardless of . The dependence among the indicators never enters the mean.
Exercise 3 (code). Verify Exercise 2 by simulation: for several values of , shuffle many times and confirm the average number of fixed points is close to 1.
Solution
import numpy as np

rng = np.random.default_rng(0)
trials = 500_000

for n in [3, 10, 52]:
    perms = rng.permuted(np.broadcast_to(np.arange(n), (trials, n)), axis=1)
    fixed = (perms == np.arange(n)).sum(axis=1)
    mean_fixed = fixed.mean()
    print(f"n={n:3d}  E[fixed points] = {mean_fixed:.4f}  (exact 1.0)")
    assert np.isclose(mean_fixed, 1.0, atol=0.02)
The average number of fixed points stays near 1 for every , matching the indicator-plus-linearity result.
That second moment is the raw material for the next lesson, which measures spread: variance.
References
- [1]Casella, G., & Berger, R. L. (2002). Statistical Inference (2nd ed.). Duxbury. §2.2, expected values and their properties.↩
- [2]Wasserman, L. (2004). All of Statistics. Springer. Ch. 3, expectation, linearity, and the law of the unconscious statistician. doi:10.1007/978-0-387-21736-9↩