 AI Knowledge Tree
Linear regression as maximum likelihood
Show that OLS is the MLE under Gaussian noise, and recover the noise variance from the residuals.
The previous lesson derived OLS from a geometric loss. The same estimator falls out of a likelihood once you say what the noise distribution is. Under Gaussian noise, OLS is the maximum-likelihood estimator, and the residuals deliver an MLE for the noise variance for free.
The probabilistic model
Replace the loss-only model with a generative assumption: targets are noisy linear functions of features,
with independent errors across examples. The unknowns are now and the noise variance .
The likelihood
The Gaussian PDF gives the likelihood of each observation:
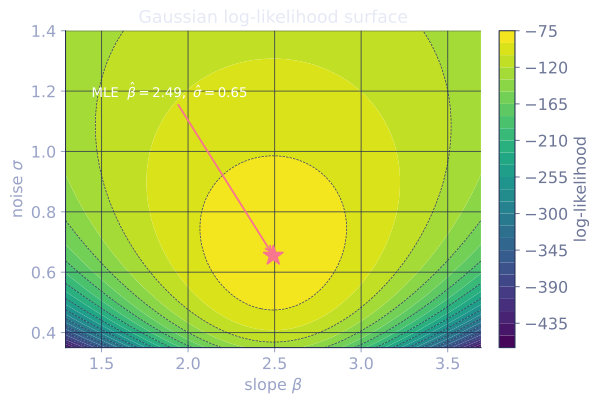
By independence, the joint log-likelihood is
MLE for : same as OLS
The only -dependent term is the sum of squared residuals, with a negative sign and positive scalar prefactor. Maximizing in is the same as minimizing the sum of squared residuals:
[1]The OLS estimator is the MLE under Gaussian noise. This is why squared-error loss is the default for regression: it is the negative log-likelihood of a Gaussian, the noise model nothing else has a reason to disagree with by default.
MLE for
Substitute back into and differentiate with respect to . Setting the derivative to zero,
where are the residuals. The MLE for noise variance is the mean squared residual. The unbiased estimator divides by instead of (the same correction that turned sample-variance into for a single sample):
The correction accounts for the degrees of freedom lost to fitting coefficients. The two estimators differ by the factor , which is the fraction by which the MLE underestimates on average, so the gap is a story about sample size. Fitting coefficients:
- : factor , the MLE runs about low. With ten points and three coefficients, three of the residuals are nearly forced to zero, and dividing by ignores that.
- : factor , a underestimate.
- (the code block's size): factor , under . The correction barely moves the answer here, which is why the two printed variances come out close.
The correction matters when is a real fraction of and is negligible when .
Why this matters
Having the likelihood gives you, in addition to point estimates:
- Confidence intervals on each via the Fisher information, which for linear regression equals [2].
- Hypothesis tests (t-tests for individual coefficients, F-tests for groups).
- Model comparison via likelihood-ratio tests and information criteria (AIC, BIC).
- The bridge to ridge regression as MAP under a Gaussian prior on , and to LASSO as MAP under a Laplace prior.
Check it on arrays
import numpy as np

rng = np.random.default_rng(1)
n, d = 500, 3
X = np.column_stack([np.ones(n), rng.normal(size=(n, d - 1))])
beta_true = np.array([1.0, 2.5, -0.8])
sigma_true = 0.7
y = X @ beta_true + sigma_true * rng.normal(size=n)

# MLE for beta = OLS
beta_hat = np.linalg.lstsq(X, y, rcond=None)[0]
print("beta_hat:", np.round(beta_hat, 3), " true:", beta_true)

# MLE vs unbiased noise variance
r = y - X @ beta_hat
sigma2_mle = np.mean(r**2)
sigma2_unbiased = np.sum(r**2) / (n - d)
print(f"sigma^2 MLE      = {sigma2_mle:.4f}")
print(f"sigma^2 unbiased = {sigma2_unbiased:.4f}")
print(f"true sigma^2     = {sigma_true**2:.4f}")

# Coefficient standard errors via Fisher info
cov_beta = sigma2_unbiased * np.linalg.inv(X.T @ X)
se = np.sqrt(np.diag(cov_beta))
print("std errors:", np.round(se, 4))
for j, (b, s, bt) in enumerate(zip(beta_hat, se, beta_true)):
    lo, hi = b - 1.96 * s, b + 1.96 * s
    inside = lo <= bt <= hi
    print(f"  beta_{j}: 95% CI [{lo:.3f}, {hi:.3f}] contains truth? {inside}")
The MLE for recovers the OLS estimate, the MLE noise variance is slightly biased low (the unbiased version with is closer to truth), and the 95% confidence intervals from the Fisher information cover the true coefficients.
Exercises
Exercise 1. A single feature-free model fits a constant: , so is the all-ones column and . Show that the MLE is the sample mean by differentiating the log-likelihood.
Solution
Step 1. With for every , the log-likelihood from the lesson is
Step 2. Only the second term depends on . Differentiate and set to zero:
Step 3. The positive prefactor drops out, leaving , so . The sample mean is the special case of OLS with an intercept-only design, and it is the MLE under Gaussian noise.
Exercise 2. Prove the residuals are orthogonal to every column of : at , where . Use this to explain why fitting coefficients forces the residual vector into an -dimensional subspace, the degrees-of-freedom story behind the divisor.
Solution
Step 1. The MLE for minimizes . The gradient is . Setting it to zero at gives .
Step 2. is independent linear constraints on the residual components (one per column of the full-rank ). The residual vector therefore lives in the orthogonal complement of the -dimensional column space, an -dimensional subspace.
Step 3. Only of the residual coordinates are free to vary; the other are pinned by the constraints. The expected squared residual length is , so dividing by (not ) returns an unbiased .
Exercise 3 (code). Confirm the bias factor empirically. Fit OLS with coefficients over many random datasets for several sample sizes, and check that the average of matches .
Solution
import numpy as np

d = 4
sigma2 = 1.5
print("n      mean(MLE)/true   expected (n-d)/n")
for n in [8, 20, 100, 1000]:
    ratios = []
    for t in range(2000):
        r = np.random.default_rng(1000 + t)
        X = np.column_stack([np.ones(n)] + [r.normal(size=n) for _ in range(d - 1)])
        beta = r.normal(size=d)
        y = X @ beta + np.sqrt(sigma2) * r.normal(size=n)
        bhat = np.linalg.lstsq(X, y, rcond=None)[0]
        res = y - X @ bhat
        ratios.append(np.mean(res**2) / sigma2)
    mean_ratio = float(np.mean(ratios))
    expected = (n - d) / n
    print(f"{n:>5}  {mean_ratio:.4f}          {expected:.4f}")
    assert np.isclose(mean_ratio, expected, atol=0.02)
The MLE runs low by the factor : about at (a underestimate when is half the sample), and effectively by , matching the lesson's claim that the correction is negligible once .
The next lesson tackles the universal tradeoff every estimator faces: bias and variance.
References
- [1]Bishop, C. M. (2006). Pattern Recognition and Machine Learning, §3.1. Springer. Least squares as Gaussian maximum likelihood.↩
- [2]Hastie, T., Tibshirani, R., & Friedman, J. (2009). The Elements of Statistical Learning (2nd ed.), §3.2. Springer. doi:10.1007/978-0-387-84858-7. Sampling distribution and inference for the coefficients.↩