 AI Knowledge Tree
Bias-variance decomposition
Decompose expected squared error into bias, variance, and noise, and read it as the central tradeoff of every estimator.
The expected error of a predictor decomposes into three independent terms: how far the average prediction sits from the truth, how much predictions wobble across datasets, and irreducible noise. Almost every regularization, ensembling, and model-selection decision in classical ML reduces to navigating this bias-variance tradeoff.
Setup
A target is generated by an unknown function plus noise,
A learner trained on a random dataset outputs a predictor . Both the training data and are random, so is also a random variable. Fix a test point and ask: what is ?
The decomposition
Theorem. For squared loss at a fixed test point,[1]
The bias measures how far the average prediction is from the truth. The variance measures how much predictions move around their average across datasets. The noise is intrinsic; no learner can reduce it.
Proof. Let . Expand around the truth and the average:
Square it and take expectations. The three terms are pairwise uncorrelated:
- is independent of and has mean zero, so its cross terms vanish.
- is a constant (no randomness), so it commutes with the expectations.
- has mean zero by construction, so its cross terms with the bias also vanish.
Expectations of the three squared terms give noise, bias squared, and variance.
What the terms control
A high-bias estimator misses the true function on average: it is too rigid for the data (linear model fitting a curve). Cutting bias means using a more expressive class.
A high-variance estimator chases the particular training set: it has the expressive power to fit, but the fits are unstable. Cutting variance means averaging across data (bagging), regularizing (ridge, LASSO), or using a simpler model.
The noise floor is the lower bound. Even the best possible predictor cannot beat it.
Where bias-variance shows up
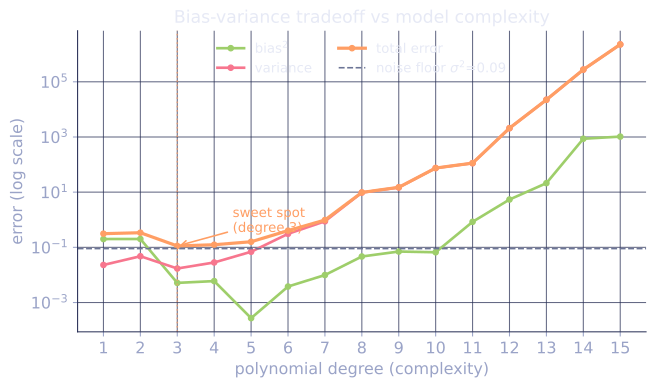
- Polynomial degree. Low-degree polynomials underfit (bias). High-degree polynomials wiggle (variance). The right degree is at the U-shape's minimum.
- k-NN. has zero training error but enormous variance. Large smooths over too much detail (bias). The bias-variance lens chooses .
- Trees vs forests. A deep tree has near-zero bias and huge variance. Averaging many decorrelated trees (bagging) kills the variance without introducing bias. This is why random forests work[2].
- Ridge and LASSO. Shrinking coefficients trades a little bias for a large variance reduction, which is the entire point of regularization.
Check it on arrays
The cleanest empirical check: vary model complexity on the same task, repeat training across many random datasets, and watch bias, variance, and total error trace out the canonical U-shape.
import numpy as np

rng = np.random.default_rng(0)

def f(x): return np.sin(2 * np.pi * x)            # ground truth
def gen_dataset(n=30, sigma=0.3, rng=rng):
    x = rng.uniform(0, 1, n)
    return x, f(x) + sigma * rng.normal(size=n)

# Evaluate at a grid of test points
x_test = np.linspace(0, 1, 200)
f_test = f(x_test)

def fit_polynomial(x, y, degree):
    coefs = np.polyfit(x, y, degree)
    return lambda x_eval: np.polyval(coefs, x_eval)

# For each degree, repeat the experiment over many random datasets
degrees = [1, 3, 5, 9, 15]
trials = 200
print("degree  bias^2     variance   total      noise (true 0.09)")
for d in degrees:
    preds = np.zeros((trials, len(x_test)))
    for t in range(trials):
        x_tr, y_tr = gen_dataset(rng=np.random.default_rng(1000 + t))
        preds[t] = fit_polynomial(x_tr, y_tr, d)(x_test)
    mean_pred = preds.mean(axis=0)
    bias2 = np.mean((mean_pred - f_test)**2)
    var = np.mean(preds.var(axis=0))
    sigma2 = 0.3**2
    total = bias2 + var + sigma2
    print(f"  {d:>2}    {bias2:.4f}    {var:.4f}    {total:.4f}   {sigma2:.4f}")
Low degrees show large bias; high degrees show large variance; total error has a U-shape with a minimum at moderate complexity.
Exercises
Exercise 1. A constant predictor ignores and always outputs a fixed value , so regardless of the data. Identify its bias, variance, and the noise term at a test point where the truth is . What does this say about the extreme low-complexity end of the tradeoff?
Solution
Step 1. The predictor is deterministic: and . The variance term vanishes.
Step 2. The bias is the gap from the truth: . The noise term is irreducible and unchanged by the choice of predictor.
Step 3. The total expected squared error is . A constant sits at the far low-complexity end: zero variance, all error pushed into bias. This is the limiting case of underfitting, the left wall of the U-shape.
Exercise 2. Bagging averages predictors trained on independent datasets, outputting . Assuming the predictors are identically distributed with variance and pairwise correlation , derive the variance of the average and explain why decorrelating the trees (small ) is what makes random forests work.
Solution
Step 1. The variance of an average of identically distributed variables with variance and pairwise correlation is
Step 2. As the second term vanishes, leaving . The averaging only drives variance down to the floor , set by the correlation.
Step 3. If the trees were perfectly correlated () the variance stays and bagging buys nothing. Random forests inject randomness (bootstrap samples, random feature subsets) to push down, so the floor drops and the variance reduction is real. The bias is unchanged because each averaged predictor is unbiased for the same target.
Exercise 3 (code). Estimate bias and variance for -nearest-neighbor regression on at the query , sweeping . Confirm that 1-NN variance is about , that variance falls as grows, and that the wide window adds bias at this peak of the sine.
Solution
import numpy as np

def f(x): return np.sin(2 * np.pi * x)
x_q = 0.25                 # the peak of the sine: wide averaging biases downward
f_q = f(x_q)
sigma = 0.3

def knn_predict(x_tr, y_tr, x_query, k):
    idx = np.argsort(np.abs(x_tr - x_query))[:k]
    return y_tr[idx].mean()

trials = 4000
print(" k    bias^2     variance")
results = {}
for k in [1, 5, 30]:
    preds = np.zeros(trials)
    for t in range(trials):
        r = np.random.default_rng(2000 + t)
        x_tr = r.uniform(0, 1, 80)
        y_tr = f(x_tr) + sigma * r.normal(size=80)
        preds[t] = knn_predict(x_tr, y_tr, x_q, k)
    bias2 = (preds.mean() - f_q) ** 2
    var = preds.var()
    results[k] = (bias2, var)
    print(f"{k:>2}   {bias2:.5f}    {var:.5f}")

assert np.isclose(results[1][1], sigma ** 2, atol=0.02)   # 1-NN variance ~ sigma^2
assert results[30][1] < results[1][1]                     # averaging cuts variance
assert results[30][0] > results[1][0]                     # wide window adds bias
1-NN carries one raw noise term, so its variance lands near ; averaging neighbors cuts the variance by roughly an order of magnitude but pulls the estimate off the peak, trading the variance for bias. This is the U-shape traversed by the single knob .
The next lesson uses this lens to motivate ridge regression: shrink the coefficients, accept a small bias, and gain a much larger variance reduction.
References
- [1]Hastie, T., Tibshirani, R., & Friedman, J. (2009). The Elements of Statistical Learning (2nd ed.), §7.3. Springer. doi:10.1007/978-0-387-84858-7. The bias-variance decomposition.↩
- [2]Geman, S., Bienenstock, E., & Doursat, R. (1992). "Neural networks and the bias/variance dilemma". Neural Computation, 4(1), 1-58. doi:10.1162/neco.1992.4.1.1↩