 AI Knowledge Tree
Poisson and Gamma GLMs
Use Poisson regression for counts and Gamma regression for positive continuous durations.
The GLM framework opens up two regression flavors that Gaussian linear regression handles badly: counts (Poisson) and positive continuous durations (Gamma). Both use a log link so the predicted mean stays positive, and both have a variance structure tied to the mean.
Poisson regression for counts
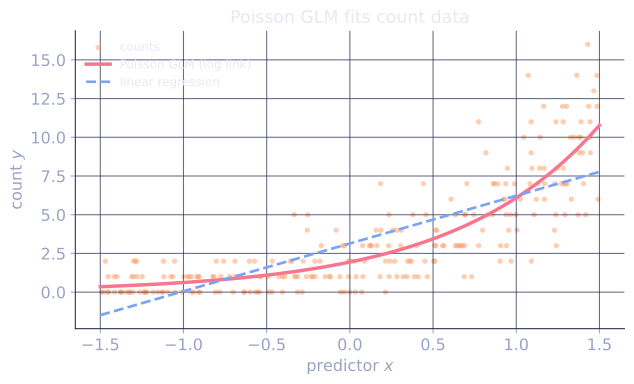
When the response is a count (number of events in a time window, clicks per session, citations per paper), the Gaussian model is wrong on two grounds: counts are nonnegative integers, and their variance grows with the mean. The Poisson model handles both.
Setup:
- Random component: , so .
- Link: log link, , hence .
The log link guarantees the mean stays positive. Coefficients are multiplicative effects on the rate: is the factor by which the expected count multiplies when increases by one unit[1].
Log-likelihood:
Concave in . The MLE has no closed form; IRLS converges quickly with and working response .
Overdispersion
The Poisson assumes . Real count data often has variance larger than the mean (overdispersion), because individual rates themselves vary across units. Two standard remedies:
- Quasi-Poisson: scale the variance by a dispersion parameter estimated from residuals, . The point estimates are the same as Poisson; the standard errors widen.
- Negative Binomial: a Poisson-gamma mixture where each unit has its own rate drawn from a Gamma distribution, allowing [2].
A back-of-envelope check: if the sample variance of is much larger than the sample mean, expect overdispersion.
Gamma regression for positive continuous responses
When is a continuous duration or amount (waiting time, insurance claim, network latency), the Gaussian linear model can predict negative means and assumes constant variance. The Gamma GLM handles both.
Setup:
- Random component: . The variance grows as , so the coefficient of variation is constant.
- Link: usually log link in practice (canonical is the reciprocal , but the log link is preferred because it cannot produce negative means).
Like Poisson, coefficients are multiplicative effects on the mean. The shape parameter is estimated from the data (or set by the user).
How to choose
A short decision guide:
- is a count, : Poisson.
- is a count, : Negative Binomial.
- is continuous with constant coefficient of variation: Gamma.
- is continuous with constant variance: linear regression on is the lazy alternative.
Check it on arrays
import numpy as np

rng = np.random.default_rng(0)

# Poisson regression on simulated counts
n, d = 500, 3
X = np.column_stack([np.ones(n), rng.normal(size=(n, d - 1))])
beta_true = np.array([0.5, 0.4, -0.3])
mu_true = np.exp(X @ beta_true)
y = rng.poisson(mu_true)

def fit_glm_log(X, y, var_fn, steps=20):
    """IRLS with log link."""
    mu = (y + 1.0).astype(float)
    for _ in range(steps):
        eta = np.log(mu)
        z = eta + (y - mu) / mu                       # canonical-link work resp
        W = mu**2 / var_fn(mu)                        # for log link: W = mu^2/Var(y)
        beta = np.linalg.solve(X.T @ (W[:, None] * X), X.T @ (W * z))
        mu = np.exp(X @ beta)
    return beta, mu

beta_pois, mu_pois = fit_glm_log(X, y, var_fn=lambda m: m)
print("Poisson coefficients:", np.round(beta_pois, 3), " (true ", beta_true, ")")

# Multiplicative interpretation: e^beta gives the rate multiplier
for j, b in enumerate(beta_pois):
    print(f"  e^beta_{j} = {np.exp(b):.3f}  -> rate multiplies by this per +1 unit")

# Gamma regression on positive continuous response with log link
beta_g_true = np.array([1.0, 0.5, -0.2])
mu_g_true = np.exp(X @ beta_g_true)
shape = 4.0
scale = mu_g_true / shape                              # so that mean = shape * scale = mu_g_true
y_g = rng.gamma(shape=shape, scale=scale)

beta_gamma, mu_gamma = fit_glm_log(X, y_g, var_fn=lambda m: m**2 / shape)
print("\nGamma coefficients:  ", np.round(beta_gamma, 3), " (true ", beta_g_true, ")")

# Check overdispersion: Poisson has Var(y) = mu
print(f"\nempirical Var/mean for Poisson data: {y.var() / y.mean():.2f}  (Poisson = 1)")
Both GLMs recover their true coefficients, the multiplicative interpretation of holds for the log link, and the Poisson sample variance is close to the sample mean.
Exercises
Exercise 1. A Poisson regression for daily store visits fits intercept and a "weekend" coefficient (with on weekends, otherwise). Compute the expected count on a weekday and on a weekend, and state the multiplicative effect of the weekend.
Solution
Step 1. The log link gives . On a weekday , so the linear predictor is and
Step 2. On a weekend , so the predictor is and
Step 3. The ratio of the two means is . The weekend multiplies the expected count by , the multiplicative reading of a log-link coefficient: each unit of the predictor scales the rate by rather than adding to it.
Exercise 2. Show that the Poisson log-likelihood is concave in , so any stationary point is the global maximum.
Solution
Step 1. Write and . The term does not depend on , so it drops out of every derivative. Differentiate one example's contribution with respect to :
using and .
Step 2. Differentiate again to get the Hessian. Since ,
Summing over examples, with and every .
Step 3. For any vector , , because each and each squared term is nonnegative. The Hessian is negative semidefinite, so is concave and any stationary point is a global maximum.
Exercise 3 (code). Overdispersion is the signature that count data violates the Poisson mean-equals-variance assumption. Simulate a negative-binomial-like process (a Poisson whose rate is itself Gamma-distributed across units) and compare its variance-to-mean ratio against a plain Poisson sample with the same mean. Assert the mixed process is overdispersed (ratio above 1.5) while the plain Poisson sits near 1.
Solution
import numpy as np

rng = np.random.default_rng(0)
n = 200_000
mean_rate = 5.0

# Plain Poisson: Var/mean should be ~1.
y_pois = rng.poisson(mean_rate, size=n)
ratio_pois = y_pois.var() / y_pois.mean()

# Poisson-Gamma mixture: each unit's rate is Gamma with mean mean_rate.
# This is the negative-binomial construction; it inflates the variance.
shape = 1.0
rates = rng.gamma(shape=shape, scale=mean_rate / shape, size=n)
y_mix = rng.poisson(rates)
ratio_mix = y_mix.var() / y_mix.mean()

print(f"plain Poisson Var/mean: {ratio_pois:.3f}")
print(f"Poisson-Gamma Var/mean: {ratio_mix:.3f}")

assert abs(ratio_pois - 1.0) < 0.05        # Poisson: variance equals mean
assert ratio_mix > 1.5                     # mixture is overdispersed
The plain Poisson sample has a variance-to-mean ratio near 1, matching . The Poisson-Gamma mixture, where each unit draws its own rate, has a ratio well above 1: this is the overdispersion that pushes the modeler from Poisson to Quasi-Poisson or Negative Binomial.
This closes the C1 linear-models track; the next subsection turns to a different geometric story: max-margin classifiers and kernels.
References
- [1]McCullagh, P., & Nelder, J. A. (1989). Generalized Linear Models (2nd ed.), §6 (Poisson), §8 (Gamma). Chapman & Hall.↩
- [2]Nelder, J. A., & Wedderburn, R. W. M. (1972). "Generalized linear models". JRSS-A, 135(3), 370-384. doi:10.2307/2344614. The original GLM treatment of Poisson and Gamma responses.↩