 AI Knowledge Tree
Bagging and random forests
Average bootstrap replicas to reduce variance, and decorrelate trees with random feature subsets.
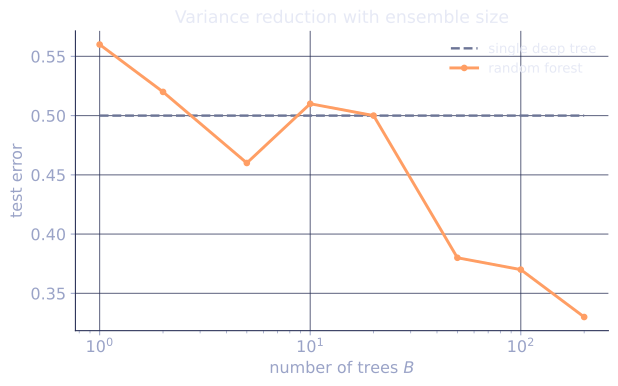
Trees are high-variance learners: small data changes produce very different trees. Bagging (bootstrap aggregating) averages many trees fit on bootstrap resamples of the data, slashing the variance without adding bias[1]. Random forests push the idea further by also randomizing which features each split can use, which decorrelates the trees and lowers variance even more[2].
Variance reduction from averaging
Let be the prediction of the -th tree, trained on a different bootstrap sample of the data. The bagged predictor averages them:
If the individual predictors are i.i.d. with variance , the average has variance . The catch: bootstrap-trained trees are not independent (they share most of the same training data), so the variance of the average is
where is the average correlation between trees. As , the variance floors at . Reducing is what random forests add on top of bagging[3].
The random-forest twist
At each split, instead of picking the best feature among all features, pick the best among a random subset of features. Typical choices: for classification, for regression. The randomness ensures that no single dominant feature appears in every tree, so trees see different subsets of structure and end up less correlated.
The cost is per-tree quality: a tree restricted to subset usually beats its larger- counterpart in training loss. The forest still wins because the ensemble variance reduction more than compensates.
Out-of-bag (OOB) estimation
A bootstrap sample contains roughly 63% unique training examples (since ). The remaining 37% are out-of-bag for that tree. Predicting an OOB example with only the trees that did not see it gives a free held-out estimate of test error, without a separate validation set.
For a random forest, the OOB error tracks held-out test error closely. It is the practical replacement for cross-validation on small datasets.
Hyperparameters
The standard knobs:
- Number of trees . Effectively a noise control: more trees never hurt accuracy and modestly help calibration; pick as large as compute allows.
max_features. Smaller means lower correlation and lower variance, but each tree fits worse.max_depth/min_samples_leaf. Less critical than in single trees, but useful for compute control.
Defaults usually work; the most useful tunable is .
Strengths and limits
Strengths:
- Excellent out-of-the-box accuracy on tabular data.
- OOB error replaces cross-validation.
- Handles mixed types and missing values gracefully.
- Robust to irrelevant features and outliers.
Limits:
- Less accurate than gradient boosting on most tabular benchmarks.
- Predictions are bounded by the training-target range (extrapolation is weak).
- Many trees means slower inference and bigger model files.
Check it on arrays
import numpy as np

rng = np.random.default_rng(0)

n, d = 400, 6
X = rng.normal(size=(n, d))
y = ((X[:, 0] + X[:, 1] > 0) ^ (X[:, 2] > 0)).astype(int)
flip = rng.random(n) < 0.10
y = np.where(flip, 1 - y, y)

def gini(labels):
    if len(labels) == 0: return 0.0
    p = np.bincount(labels, minlength=2) / len(labels)
    return 1 - np.sum(p**2)

class Node:
    def __init__(self): self.leaf = None; self.feature = self.threshold = self.left = self.right = None

def split(X, y, m, rng):
    n, d = X.shape
    feats = rng.choice(d, size=min(m, d), replace=False)
    best = (None, None, -1)
    parent = gini(y)
    for j in feats:
        for t in np.unique(X[:, j]):
            mm = X[:, j] <= t
            if mm.sum() == 0 or (~mm).sum() == 0: continue
            gain = parent - (mm.sum()/n)*gini(y[mm]) - ((~mm).sum()/n)*gini(y[~mm])
            if gain > best[2]: best = (j, t, gain)
    return best

def build(X, y, m, rng, max_depth=8):
    node = Node()
    if max_depth == 0 or len(y) < 2 or gini(y) == 0:
        node.leaf = int(np.argmax(np.bincount(y, minlength=2))); return node
    j, t, gain = split(X, y, m, rng)
    if j is None or gain <= 0:
        node.leaf = int(np.argmax(np.bincount(y, minlength=2))); return node
    mm = X[:, j] <= t
    node.feature, node.threshold = j, t
    node.left = build(X[mm], y[mm], m, rng, max_depth - 1)
    node.right = build(X[~mm], y[~mm], m, rng, max_depth - 1)
    return node

def predict(node, x):
    while node.leaf is None:
        node = node.left if x[node.feature] <= node.threshold else node.right
    return node.leaf

# Random forest
idx_te = rng.choice(n, size=100, replace=False)
idx_tr = np.setdiff1d(np.arange(n), idx_te)
Xtr, ytr = X[idx_tr], y[idx_tr]
Xte, yte = X[idx_te], y[idx_te]

def random_forest(Xtr, ytr, B=50, m=2, rng=rng):
    trees, oob_idx = [], []
    n_tr = len(ytr)
    for _ in range(B):
        sample = rng.integers(0, n_tr, n_tr)
        trees.append(build(Xtr[sample], ytr[sample], m=m, rng=rng))
        oob_idx.append(np.setdiff1d(np.arange(n_tr), sample))
    return trees, oob_idx

trees, oob_idx = random_forest(Xtr, ytr, B=50, m=2, rng=rng)
pred_te = np.mean([[predict(t, x) for x in Xte] for t in trees], axis=0)
acc_te = np.mean((pred_te > 0.5) == yte)
print(f"random-forest test acc: {acc_te:.3f}")

# OOB error: for each training point, average predictions from trees that did not see it
counts = np.zeros(len(ytr))
votes = np.zeros(len(ytr))
for tree, oob in zip(trees, oob_idx):
    for i in oob:
        votes[i] += predict(tree, Xtr[i]); counts[i] += 1
mask = counts > 0
oob_pred = votes[mask] / counts[mask]
oob_acc = np.mean((oob_pred > 0.5) == ytr[mask])
print(f"OOB accuracy:        {oob_acc:.3f}  "
      f"(over {int(mask.sum())}/{len(ytr)} examples with >=1 OOB tree)")

# Single tree vs forest
single = build(Xtr, ytr, m=d, rng=rng, max_depth=8)
single_acc = np.mean([predict(single, x) for x in Xte] == yte)
print(f"single tree test acc: {single_acc:.3f}  (forest reduces variance over this)")
The random forest beats the single tree on the noisy test set, and the OOB accuracy tracks the held-out test accuracy.
Exercises
Exercise 1. Using the variance bound for the average of trees, take . Compute the limiting variance as for (plain bagged trees) and (decorrelated forest trees), and the variance at for each. Explain what the two numbers say about why random forests help.
Solution
Step 1. As the second term vanishes, leaving the floor . So the limit is for bagging and for the forest.
Step 2. At add the finite- term :
Step 3. Even with 50 trees the variance is dominated by the floor , not the averaging term. Adding more trees drives the term toward 0 but cannot cross the floor, so lowering (the random-feature twist) is the only way to push the limiting variance from down to . More trees alone cannot.
Exercise 2. The lesson states a bootstrap sample of size contains about 63% unique examples. Derive the limit, and explain why the remaining fraction is the out-of-bag set used for free error estimation.
Solution
Step 1. A fixed example is missed by one draw with probability . Draws are independent with replacement, so it is missed by all draws with probability .
Step 2. Take the limit using :
So the expected fraction of examples that do appear is , the 63% unique figure.
Step 3. The roughly 37% of examples a given tree never saw are out-of-bag for that tree. Predicting each example using only the trees that excluded it gives a held-out estimate at no extra cost, because each tree's training set already left those examples aside.
Exercise 3 (code). Demonstrate decorrelation directly: fit two ensembles on the same data, one choosing the best split among all features (, plain bagging) and one among a random subset (). Estimate the average pairwise correlation of tree predictions in each, and confirm the random-subset forest is less correlated.
Solution
Step 1. Reuse the lesson's tree builder. Collect each tree's prediction vector on a held-out set, stack them, and average the off-diagonal entries of the prediction correlation matrix.
import numpy as np

rng = np.random.default_rng(0)
n, d = 400, 6
X = rng.normal(size=(n, d))
y = ((X[:, 0] + X[:, 1] > 0) ^ (X[:, 2] > 0)).astype(int)

def gini(labels):
    if len(labels) == 0: return 0.0
    p = np.bincount(labels, minlength=2) / len(labels)
    return 1 - np.sum(p**2)

class Node:
    def __init__(self): self.leaf = self.feature = self.threshold = self.left = self.right = None

def split(X, y, m, rng):
    n, d = X.shape
    feats = rng.choice(d, size=min(m, d), replace=False)
    best = (None, None, -1); parent = gini(y)
    for j in feats:
        for t in np.unique(X[:, j]):
            mm = X[:, j] <= t
            if mm.sum() == 0 or (~mm).sum() == 0: continue
            gain = parent - (mm.sum()/n)*gini(y[mm]) - ((~mm).sum()/n)*gini(y[~mm])
            if gain > best[2]: best = (j, t, gain)
    return best

def build(X, y, m, rng, max_depth=6):
    node = Node()
    if max_depth == 0 or len(y) < 2 or gini(y) == 0:
        node.leaf = int(np.argmax(np.bincount(y, minlength=2))); return node
    j, t, gain = split(X, y, m, rng)
    if j is None or gain <= 0:
        node.leaf = int(np.argmax(np.bincount(y, minlength=2))); return node
    mm = X[:, j] <= t; node.feature, node.threshold = j, t
    node.left = build(X[mm], y[mm], m, rng, max_depth - 1)
    node.right = build(X[~mm], y[~mm], m, rng, max_depth - 1)
    return node

def predict(node, x):
    while node.leaf is None:
        node = node.left if x[node.feature] <= node.threshold else node.right
    return node.leaf

Xtr, ytr, Xte = X[:300], y[:300], X[300:]

def mean_pairwise_corr(m, B=25):
    preds = []
    for _ in range(B):
        s = rng.integers(0, len(ytr), len(ytr))
        tree = build(Xtr[s], ytr[s], m=m, rng=rng)
        preds.append([predict(tree, x) for x in Xte])
    P = np.array(preds, float)
    P = P[P.std(axis=1) > 0]                 # drop constant-prediction trees
    C = np.corrcoef(P)
    off = C[np.triu_indices_from(C, k=1)]
    return np.nanmean(off)

corr_full = mean_pairwise_corr(m=6)          # plain bagging, all features
corr_sub = mean_pairwise_corr(m=2)           # random subset
assert corr_sub < corr_full                  # random subsets decorrelate trees
print(f"mean tree correlation: m=d {corr_full:.3f}, m=2 {corr_sub:.3f}")
Step 2. The random-subset ensemble shows lower mean pairwise correlation than the all-feature ensemble. That is exactly the in the variance bound: a smaller lowers the floor that no amount of averaging can beat, which is why the forest generalizes better than plain bagging.
The next lesson opens the black box: how to read feature importance from a forest.
References
- [1]Breiman, L. (1996). "Bagging predictors". Machine Learning, 24(2), 123-140. Bootstrap aggregation as a variance-reduction scheme (doi:10.1007/BF00058655).↩
- [2]Breiman, L. (2001). "Random forests". Machine Learning, 45(1), 5-32. Decorrelating bagged trees with random feature subsets (doi:10.1023/A:1010933404324).↩
- [3]Hastie, T., Tibshirani, R., & Friedman, J. (2009). The Elements of Statistical Learning (2nd ed.). Springer. The correlation-variance bound for averaged predictors (doi:10.1007/978-0-387-84858-7).↩