 AI Knowledge Tree
Low-rank approximation (Eckart–Young) & PCA
Prove the truncated SVD is the best low-rank approximation, and identify PCA as the SVD of the centered data matrix.
Storing a full matrix costs numbers. Often the matrix is approximately low-rank: most of the information lives in a few directions. The Eckart–Young theorem says the truncated SVD is the optimal compression, and PCA applies this directly to data.
Low-rank approximation
The rank- truncated SVD of is
using only the largest singular values and their associated vectors. is a rank- matrix (a sum of rank-1 outer products).
Eckart–Young theorem. Among all rank- matrices [1],
and the same holds with the spectral norm (largest singular value). The truncated SVD is the closest rank- matrix to in both the Frobenius and spectral norms.
Proof sketch (Frobenius norm). Write the Frobenius norm using singular values: . The approximation error is
For any rank- matrix , has a null space of dimension , so there exists a nonzero in (the intersection of a -dimensional space with the -dimensional null space of ; by dimension count this is at least 1-dimensional). Then
where the last inequality uses the fact that is in the span of the first right singular vectors and . A more careful argument shows the lower bound is , matching the error of .
Energy captured
The fraction of variance explained by is
Plotting this as a function of gives the scree plot: the knee where adding more components yields diminishing returns is the natural choice of rank.
PCA as truncated SVD
Given a data matrix (rows = samples, columns = features), principal component analysis (PCA) proceeds[2, 3]:
- Center: subtract the column means, obtaining with mean zero.
- Compute SVD: .
- Project onto components: the score matrix is , where is the first columns of .
The -th column of (the -th right singular vector) is the -th principal direction: the direction of maximum remaining variance after removing the previous directions. The corresponding singular value encodes how much variance lies along it ( is the variance in that direction).
The covariance matrix is , so the principal directions are the eigenvectors of the sample covariance and the principal variances are its eigenvalues.
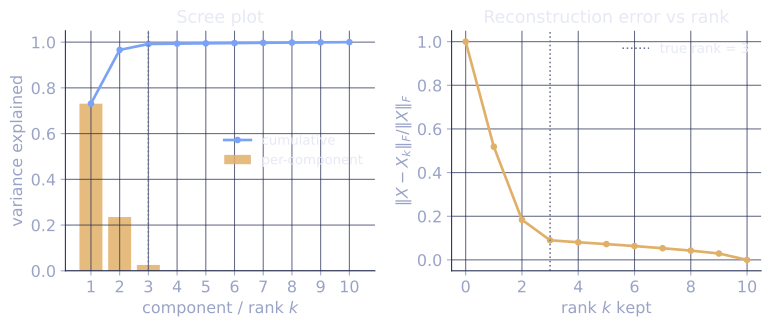
Check it on arrays
import numpy as np

rng = np.random.default_rng(42)

# Synthetic data: 200 samples, 10 features, low-rank signal
d, n, k_true = 10, 200, 3
V_true = np.linalg.qr(rng.normal(size=(d, k_true)))[0]   # 3 orthonormal directions
scores = rng.normal(scale=[5, 3, 1], size=(n, k_true))    # varying variance
X = scores @ V_true.T + 0.2 * rng.normal(size=(n, d))    # signal + noise

# Center
X_c = X - X.mean(axis=0)

# SVD
U, s, Vt = np.linalg.svd(X_c, full_matrices=False)

# Scree: fraction of variance explained
total = (s**2).sum()
explained = np.cumsum(s**2) / total
print("cumulative variance explained (k=1,2,3,4):", np.round(explained[:4], 3))

# Rank-k approximation
k = 3
X_approx = U[:, :k] * s[:k] @ Vt[:k, :]
print(f"rank-{k} Frobenius error / total norm:", np.linalg.norm(X_c - X_approx, 'fro') / np.linalg.norm(X_c, 'fro'))

# PCA scores: project onto first k principal directions
Z = X_c @ Vt[:k].T    # (n, k) scores
print("variance of first component:", np.var(Z[:, 0], ddof=1))
print("expected (s[0]^2 / (n-1)):", s[0]**2 / (n - 1))
The first three components capture most of the variance; the rank-3 approximation has low relative error; and the PCA score variance matches the expected formula.
Exercises
Exercise 1. A matrix has singular values . Compute the best rank-2 Frobenius approximation error and the fraction of variance explained by the first two components.
Solution
Step 1. By Eckart–Young, the rank-2 error in Frobenius norm uses the discarded singular values :
Step 2. The fraction of variance explained is the kept energy over the total energy, with energy measured as squared singular values:
The first two components hold about 83 percent of the variance, and the leftover error is the root-sum-square of the two smallest singular values.
Exercise 2. Prove that the rank- truncated SVD error in Frobenius norm is exactly . Use the unitary invariance of the Frobenius norm.
Solution
Step 1. Write the error matrix using the SVD. With and , the difference keeps only the tail:
where zeroes the first singular values.
Step 2. The Frobenius norm is unitarily invariant: for orthogonal , because and the trace is unchanged by conjugation with orthogonal matrices. So
The error is read off directly from the discarded singular values, with no cross terms surviving.
Exercise 3 (code). Generate data along two orthogonal directions with variances 9 and 1 plus small noise. Confirm that PCA recovers the two principal directions (up to sign) and that the first principal variance is near 9.
Solution
import numpy as np

rng = np.random.default_rng(7)
n = 4000
d1 = np.array([1.0, 0.0])           # true principal directions
d2 = np.array([0.0, 1.0])
s1 = rng.normal(scale=3.0, size=n)  # variance 9 along d1
s2 = rng.normal(scale=1.0, size=n)  # variance 1 along d2
X = np.outer(s1, d1) + np.outer(s2, d2) + 0.01 * rng.normal(size=(n, 2))

Xc = X - X.mean(axis=0)
U, sv, Vt = np.linalg.svd(Xc, full_matrices=False)

# First principal variance = sigma_1^2 / (n - 1) should be ~ 9.
var1 = sv[0]**2 / (n - 1)
assert abs(var1 - 9.0) < 0.5

# First principal direction aligns with d1 (sign is arbitrary).
assert abs(abs(Vt[0] @ d1) - 1.0) < 1e-2
print("first principal variance:", round(float(var1), 3))
The largest singular value reproduces the dominant variance of 9, and its right singular vector lines up with the direction that variance lives along, which is what PCA is built to find.
With the best low-rank approximation understood, the next lesson looks at the factorizations that solve linear systems efficiently without forming inverses.
References
- [1]Eckart, C., & Young, G. (1936). "The approximation of one matrix by another of lower rank". Psychometrika, 1, 211-218. doi:10.1007/BF02288367. The original optimality proof for the truncated SVD.↩
- [2]Jolliffe, I. T. (2002). Principal Component Analysis (2nd ed.). Springer. The standard reference for PCA and the variance-maximization view.↩
- [3]Strang, G. (2016). Introduction to Linear Algebra (5th ed.). Wellesley-Cambridge Press. PCA as the SVD of the centered data matrix.↩