 AI Knowledge Tree
Linear and quadratic discriminant analysis
Model classes as Gaussians (shared or per-class covariance) and derive linear vs quadratic decision boundaries.
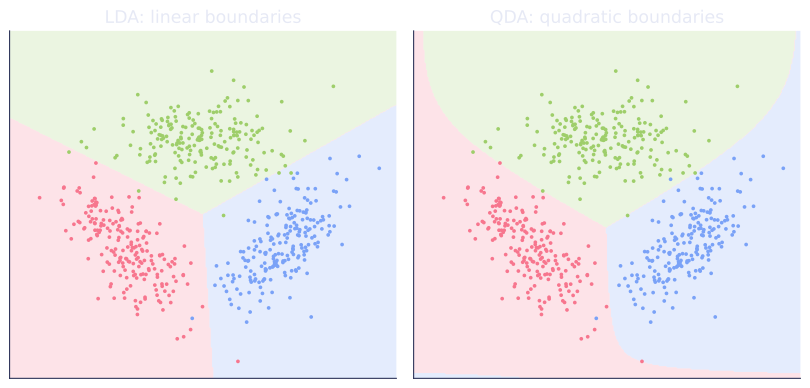
Naive Bayes assumes feature independence given the class. LDA and QDA drop that assumption: each class gets a full multivariate Gaussian, including covariances between features[1]. The shape of the decision boundary falls out of whether the classes share covariance or not.
The setup
Assume each class has a multivariate Gaussian class-conditional:
With class priors , the Bayes-optimal classifier picks . Taking the log, the discriminant function for class is
The classifier picks .
QDA: per-class covariance
If each class has its own covariance , the quadratic term in does not cancel across classes, so the decision boundary is quadratic in . This is Quadratic Discriminant Analysis (QDA).
QDA has parameters per class plus the prior, totaling roughly parameters. With small training sets per class, the covariance estimates become unstable and the boundaries follow the noise.
LDA: shared covariance
If all classes share the same , the quadratic term cancels in pairwise comparisons. The discriminant becomes
which is linear in . The decision boundaries are hyperplanes; this is Linear Discriminant Analysis (LDA)[2].
LDA has only parameters and is more stable than QDA in
small-sample regimes. It is the right starting point and what
sklearn.discriminant_analysis.LinearDiscriminantAnalysis runs by default.
Regularized variants
When is ill-conditioned (small , large , or collinear features):
- Shrinkage LDA: . Cross-validate . Especially useful in high-dimensional settings like text and genomics.
- Diagonal LDA: zero out off-diagonals of . Equivalent to Gaussian Naive Bayes with shared variance per feature.
LDA vs logistic regression
Both produce linear decision boundaries. They differ in what they assume and optimize:
- LDA assumes Gaussian class-conditionals with shared covariance, fits by plug-in MLE on those Gaussians.
- Logistic regression assumes only that the log-odds are linear in , fits by maximizing the conditional likelihood [3].
When the LDA assumption is approximately correct, LDA tends to be more data-efficient. When it is grossly wrong (non-Gaussian features), logistic regression is more robust. Logistic also handles directly without needing to model , which is appealing when is high-dimensional and unmodelable.
Check it on arrays
import numpy as np

rng = np.random.default_rng(0)

# Three classes with different covariances (QDA-favorable)
n_per = 200
mu = [np.array([2.0, 0.0]), np.array([-2.0, 0.0]), np.array([0.0, 2.0])]
cov = [np.array([[1.0, 0.0], [0.0, 0.5]]),
       np.array([[0.5, 0.0], [0.0, 1.0]]),
       np.array([[1.0, 0.7], [0.7, 1.0]])]

X, y = [], []
for c, (m, S) in enumerate(zip(mu, cov)):
    L = np.linalg.cholesky(S)
    Xc = rng.normal(size=(n_per, 2)) @ L.T + m
    X.append(Xc); y.extend([c] * n_per)
X = np.vstack(X); y = np.array(y)

idx = rng.permutation(len(y)); tr, te = idx[:400], idx[400:]
Xtr, ytr = X[tr], y[tr]; Xte, yte = X[te], y[te]

def fit_lda(X, y):
    classes = np.unique(y); d = X.shape[1]
    Sigma = np.zeros((d, d))
    means = {}; priors = {}
    for c in classes:
        Xc = X[y == c]
        mu_c = Xc.mean(axis=0)
        means[c] = mu_c; priors[c] = len(Xc) / len(X)
        Sigma += (Xc - mu_c).T @ (Xc - mu_c)
    Sigma /= len(X) - len(classes)
    return means, Sigma, priors

def fit_qda(X, y):
    classes = np.unique(y)
    params = {}
    for c in classes:
        Xc = X[y == c]
        mu_c = Xc.mean(axis=0); Sigma_c = np.cov(Xc.T) + 1e-4 * np.eye(Xc.shape[1])
        params[c] = (mu_c, Sigma_c, len(Xc) / len(X))
    return params

def predict_lda(X, means, Sigma, priors):
    inv = np.linalg.inv(Sigma); classes = list(means.keys())
    scores = []
    for c in classes:
        mu = means[c]
        s = X @ inv @ mu - 0.5 * mu @ inv @ mu + np.log(priors[c])
        scores.append(s)
    return np.array(classes)[np.argmax(scores, axis=0)]

def predict_qda(X, params):
    classes = list(params.keys()); scores = []
    for c, (mu, Sigma, pi) in params.items():
        inv = np.linalg.inv(Sigma)
        sign, logdet = np.linalg.slogdet(Sigma)
        diff = X - mu
        s = -0.5 * logdet - 0.5 * np.sum(diff @ inv * diff, axis=1) + np.log(pi)
        scores.append(s)
    return np.array(classes)[np.argmax(scores, axis=0)]

means, Sigma, priors = fit_lda(Xtr, ytr)
qda = fit_qda(Xtr, ytr)

print(f"LDA test acc: {np.mean(predict_lda(Xte, means, Sigma, priors) == yte):.3f}")
print(f"QDA test acc: {np.mean(predict_qda(Xte, qda) == yte):.3f}")
print("QDA wins when classes have different covariances; LDA wins when shared.")
QDA usually edges out LDA here because the three Gaussians have genuinely different covariances.
Exercises
Exercise 1. Take two classes with shared covariance (the identity), means and , and equal priors . Using the LDA discriminant , derive the decision boundary and state where it sits geometrically.
Solution
Step 1. With and equal priors, the log-prior terms are equal and cancel, and . So .
Step 2. Write the two discriminants. For : . For : .
Step 3. Set them equal: , giving .
Step 4. The boundary is the vertical line , the perpendicular bisector of the segment joining and . With equal covariance and equal priors, LDA assigns each point to the nearer class mean, so the boundary is exactly midway between the means.
Exercise 2. QDA fits a separate covariance per class. Count the free parameters of QDA versus LDA for classes in dimensions (means, the covariance term, and free priors). Evaluate both for , and argue which is at greater risk of overfitting a small sample.
Solution
Step 1. Both models have class means of entries each: mean parameters. Both have free prior parameters (the priors sum to ).
Step 2. A covariance matrix in dimensions is symmetric, so it has free entries. QDA stores one per class: covariance parameters. LDA stores a single shared one: .
Step 3. For , : . QDA covariance parameters ; LDA . Means contribute and priors to both.
Step 4. QDA carries about parameters against LDA's about , roughly more, almost all in the per-class covariances. With few samples per class those covariances are estimated from little data and become unstable, so QDA is at far greater risk of overfitting; LDA's pooled covariance is the safer default in the small-sample, large- regime.
Exercise 3 (code). When the classes truly share a covariance, LDA should match or beat QDA, because QDA spends parameters estimating per-class covariances that are all the same. Generate three classes with a common covariance and a modest sample size, then compare LDA and QDA test accuracy, reusing the fitting code from the lesson.
Solution
import numpy as np

rng = np.random.default_rng(1)

# Shared covariance across all three classes (LDA-favorable), small sample.
n_per = 40
shared = np.array([[1.0, 0.6], [0.6, 1.0]])
L = np.linalg.cholesky(shared)
mu = [np.array([2.0, 0.0]), np.array([-2.0, 0.0]), np.array([0.0, 2.0])]
X, y = [], []
for c, m in enumerate(mu):
    X.append(rng.normal(size=(n_per, 2)) @ L.T + m)
    y.extend([c] * n_per)
X = np.vstack(X); y = np.array(y)

idx = rng.permutation(len(y)); tr, te = idx[:80], idx[80:]
Xtr, ytr = X[tr], y[tr]; Xte, yte = X[te], y[te]

def fit_lda(X, y):
    classes = np.unique(y); d = X.shape[1]
    Sigma = np.zeros((d, d)); means = {}; priors = {}
    for c in classes:
        Xc = X[y == c]; mu_c = Xc.mean(axis=0)
        means[c] = mu_c; priors[c] = len(Xc) / len(X)
        Sigma += (Xc - mu_c).T @ (Xc - mu_c)
    Sigma /= len(X) - len(classes)
    return means, Sigma, priors

def predict_lda(X, means, Sigma, priors):
    inv = np.linalg.inv(Sigma); classes = list(means.keys()); scores = []
    for c in classes:
        mu = means[c]
        scores.append(X @ inv @ mu - 0.5 * mu @ inv @ mu + np.log(priors[c]))
    return np.array(classes)[np.argmax(scores, axis=0)]

def fit_qda(X, y):
    classes = np.unique(y); params = {}
    for c in classes:
        Xc = X[y == c]
        params[c] = (Xc.mean(axis=0), np.cov(Xc.T) + 1e-4 * np.eye(Xc.shape[1]),
                     len(Xc) / len(X))
    return params

def predict_qda(X, params):
    classes = list(params.keys()); scores = []
    for c, (mu, Sigma, pi) in params.items():
        inv = np.linalg.inv(Sigma)
        _, logdet = np.linalg.slogdet(Sigma)
        diff = X - mu
        scores.append(-0.5 * logdet - 0.5 * np.sum(diff @ inv * diff, axis=1)
                      + np.log(pi))
    return np.array(classes)[np.argmax(scores, axis=0)]

means, Sigma, priors = fit_lda(Xtr, ytr)
qda = fit_qda(Xtr, ytr)
acc_lda = np.mean(predict_lda(Xte, means, Sigma, priors) == yte)
acc_qda = np.mean(predict_qda(Xte, qda) == yte)
print(f"LDA test acc: {acc_lda:.3f}")
print(f"QDA test acc: {acc_qda:.3f}")
assert acc_lda >= acc_qda
With a genuinely shared covariance and only points per class, LDA's pooled estimate is steadier than QDA's three noisy per-class covariances, so LDA matches or beats QDA, the reverse of the lesson's per-class-covariance setup.
The next lesson reuses the LDA setup as a dimensionality-reduction method, the supervised twin of PCA.
References
- [1]Hastie, T., Tibshirani, R., & Friedman, J. (2009). The Elements of Statistical Learning (2nd ed.). Springer. LDA and QDA discriminants from Gaussian class-conditionals (§4.3) (doi:10.1007/978-0-387-84858-7).↩
- [2]Fisher, R. A. (1936). "The use of multiple measurements in taxonomic problems". Annals of Eugenics, 7(2), 179-188. The origin of linear discriminant analysis (doi:10.1111/j.1469-1809.1936.tb02137.x).↩
- [3]Bishop, C. M. (2006). Pattern Recognition and Machine Learning. Springer. Generative vs discriminative linear classifiers, LDA against logistic regression (§4.2-4.3).↩