 AI Knowledge Tree
k-nearest neighbors
Predict by majority vote (classification) or average (regression) over the k closest points, and choose k by cross-validation.
The simplest learning rule: to predict for a new point, find the closest training examples and reuse their labels. k-nearest neighbors (k-NN) has no training step (it stores the data) and almost no inductive bias beyond "nearby points have similar labels"[1]. It is a useful baseline, a sanity check, and a stepping stone to the curse-of-dimensionality lesson that follows.
The algorithm
To predict for a query :
- Compute distances to every training point.
- Pick the nearest neighbors.
- For classification: predict the majority class among the neighbors. For regression: predict their mean (or median for robustness).
There is no model to fit. Inference walks the entire training set, costing per query (which is what the C8 lessons on approximate nearest neighbor address).
Choosing
is the regularization knob:
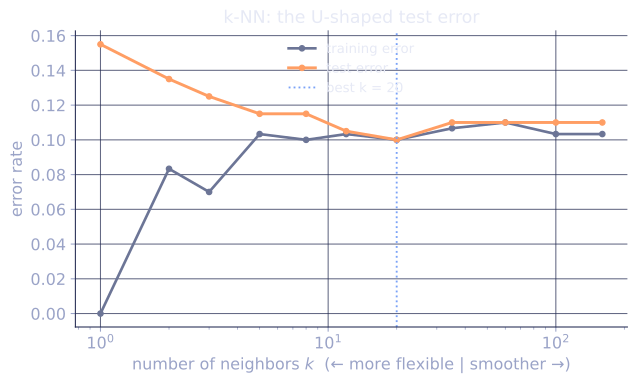
- : zero training error but enormous variance. Each prediction is determined by a single point, so noise dominates.
- large: low variance (averaging stabilizes the prediction) but high bias (averaging across distant points blurs the structure). predicts the global mean / majority everywhere.
Pick by cross-validation[2]. Common practice for classification: odd to avoid ties; values in the range to are typical starting points.
Distance choices
- Euclidean (): default for continuous features, after scaling.
- Manhattan (): more robust to outliers.
- Cosine: for high-dimensional sparse representations (text, embeddings).
- Hamming: for binary or categorical features.
Whatever metric, features must be scaled before computing distances. A feature in dollars and one in millimeters will let the dollar feature dominate every distance computation if both are raw.
Weighted k-NN
Instead of all neighbors voting equally, weight each by or by a kernel of distance. Closer neighbors get more say. Smooths the predictor and makes less sensitive.
What k-NN does badly
- High dimensions: distances concentrate (next lesson), so every point is about as far as every other and the "nearest" neighbor barely means anything.
- Slow inference: per query; production systems use KD-trees, ball trees, or ANN indices (C8).
- Memory hungry: the model is the training set.
- No probabilities by default: vote fractions are uncalibrated.
Strengths
- Trivial to implement and reason about.
- No assumptions on the target's shape, smoothness, or distribution.
- Locally adapts: complex decision boundaries cost no extra fitting effort.
- Good baseline for tabular problems on small to medium .
Check it on arrays
import numpy as np

rng = np.random.default_rng(0)

# Binary classification: two Gaussian blobs
n_per = 150
X_pos = rng.normal(loc=[1.5, 0.5], scale=0.7, size=(n_per, 2))
X_neg = rng.normal(loc=[-1.0, -0.5], scale=0.7, size=(n_per, 2))
X = np.vstack([X_pos, X_neg])
y = np.array([1] * n_per + [0] * n_per)

idx = rng.permutation(len(y))
tr, te = idx[:200], idx[200:]
Xtr, ytr = X[tr], y[tr]
Xte, yte = X[te], y[te]

def knn_predict(Xq, Xtr, ytr, k=5):
    d = np.sqrt(((Xq[:, None, :] - Xtr[None, :, :])**2).sum(axis=2))
    nn = np.argsort(d, axis=1)[:, :k]                  # k nearest indices per query
    votes = ytr[nn]
    # Majority vote (binary)
    return (votes.sum(axis=1) > k / 2).astype(int)

for k in [1, 3, 5, 11, 51]:
    y_pred = knn_predict(Xte, Xtr, ytr, k=k)
    acc = np.mean(y_pred == yte)
    print(f"k={k:>3}: test accuracy={acc:.3f}")

# Distance matters: add a noisy feature with a huge scale and watch the
# informative features get drowned out (no train/query mismatch, just
# a feature whose magnitude dominates the L2 distance).
noise_tr = 100.0 * rng.normal(size=(len(Xtr), 1))
noise_te = 100.0 * rng.normal(size=(len(Xte), 1))
Xtr_noisy = np.column_stack([Xtr, noise_tr])
Xte_noisy = np.column_stack([Xte, noise_te])
acc_bad = np.mean(knn_predict(Xte_noisy, Xtr_noisy, ytr, k=5) == yte)
acc_ok  = np.mean(knn_predict(Xte, Xtr, ytr, k=5) == yte)
print(f"\nwith a noisy feature on scale 100: acc={acc_bad:.3f}  (drowns out signal)")
print(f"informative features only:         acc={acc_ok:.3f}")

# Regression k-NN: average instead of vote
y_reg = X[:, 0] + 0.3 * rng.normal(size=len(X))
def knn_regress(Xq, Xtr, y_reg_tr, k=5):
    d = np.sqrt(((Xq[:, None, :] - Xtr[None, :, :])**2).sum(axis=2))
    nn = np.argsort(d, axis=1)[:, :k]
    return y_reg_tr[nn].mean(axis=1)

y_reg_tr = y_reg[tr]; y_reg_te = y_reg[te]
rmse = np.sqrt(np.mean((knn_regress(Xte, Xtr, y_reg_tr, k=10) - y_reg_te)**2))
print(f"k-NN regression test RMSE: {rmse:.3f}")
The U-shape in is visible: overfits, large underfits, with the sweet spot in between. Adding one high-magnitude noise feature drowns out the informative ones, confirming the scaling caveat.
Exercises
Exercise 1. A 1-NN classifier is trained on the four labeled points , , , on the real line, with distance . Predict the label at the query and at , and find the location of the decision boundary between the and regions.
Solution
Step 1. At , the distances to the four points are , , , . The nearest are the point at (label ) and the point at (label ), both at distance . The tie is broken toward the smaller index here, but the point of the exercise is the boundary, so push slightly off the tie.
Step 2. At , distances are , , , . The unique nearest is the point at (label ), so the prediction is .
Step 3. The boundary sits where the nearest point and the nearest point are equidistant. The relevant pair is the point at and the point at ; their midpoint is . Queries with are nearer the point at and predict ; queries with are nearer the point at and predict . The decision boundary is .
Exercise 2. With (every neighbor votes), show that k-NN classification predicts the global majority class at every query, and k-NN regression predicts the global mean of the training targets at every query. Explain why this is the maximum-bias, zero-variance end of the knob.
Solution
Step 1. When , the set of nearest neighbors is the entire training set for any query, regardless of , because there are only points to choose from. The neighbor set no longer depends on .
Step 2. Classification predicts the majority label among the neighbors. Since the neighbors are all points, that majority is the global majority class, the same for every query.
Step 3. Regression predicts the mean of the neighbor targets, which is , the global training mean, again independent of .
Step 4. The prediction is a single constant over the whole input space, so it cannot track any local structure: that is maximal bias. But the prediction depends on the full sample only through one average, so resampling the training set barely moves it: that is minimal variance. This is the high-bias, low-variance extreme opposite to .
Exercise 3 (code). Implement distance-weighted k-NN classification, where each of the neighbors votes with weight for a small instead of weight . On a two-blob problem, confirm that at the weighted variant matches or beats uniform voting on test accuracy.
Solution
import numpy as np

rng = np.random.default_rng(0)

n_per = 150
X_pos = rng.normal(loc=[1.5, 0.5], scale=0.7, size=(n_per, 2))
X_neg = rng.normal(loc=[-1.0, -0.5], scale=0.7, size=(n_per, 2))
X = np.vstack([X_pos, X_neg])
y = np.array([1] * n_per + [0] * n_per)

idx = rng.permutation(len(y))
tr, te = idx[:200], idx[200:]
Xtr, ytr = X[tr], y[tr]
Xte, yte = X[te], y[te]

def dists(Xq, Xtr):
    return np.sqrt(((Xq[:, None, :] - Xtr[None, :, :]) ** 2).sum(axis=2))

def knn_uniform(Xq, Xtr, ytr, k):
    nn = np.argsort(dists(Xq, Xtr), axis=1)[:, :k]
    return (ytr[nn].sum(axis=1) > k / 2).astype(int)

def knn_weighted(Xq, Xtr, ytr, k, eps=1e-6):
    d = dists(Xq, Xtr)
    nn = np.argsort(d, axis=1)[:, :k]
    rows = np.arange(len(Xq))[:, None]
    w = 1.0 / (d[rows, nn] + eps)                  # weight per neighbor
    labels = ytr[nn]
    vote_pos = (w * (labels == 1)).sum(axis=1)
    vote_neg = (w * (labels == 0)).sum(axis=1)
    return (vote_pos > vote_neg).astype(int)

k = 15
acc_uniform = np.mean(knn_uniform(Xte, Xtr, ytr, k) == yte)
acc_weighted = np.mean(knn_weighted(Xte, Xtr, ytr, k) == yte)
print(f"uniform  k={k}: acc={acc_uniform:.3f}")
print(f"weighted k={k}: acc={acc_weighted:.3f}")
assert acc_weighted >= acc_uniform
Distance weighting lets nearby neighbors outvote the more distant members of the top- set, so it recovers some of the resolution a large uniform washes out.
The next lesson explains why all of this gets worse as the dimension grows.
References
- [1]Cover, T. M., & Hart, P. E. (1967). "Nearest neighbor pattern classification". IEEE Transactions on Information Theory, 13(1), 21-27. The original analysis of the nearest-neighbor rule and its asymptotic error bound (doi:10.1109/TIT.1967.1053964).↩
- [2]Hastie, T., Tibshirani, R., & Friedman, J. (2009). The Elements of Statistical Learning (2nd ed.). Springer. k-NN as a baseline and the bias-variance role of (§13.3) (doi:10.1007/978-0-387-84858-7).↩