 AI Knowledge Tree
DBSCAN
Define clusters as dense, connected regions, separate noise points, and pick eps from a k-distance plot.
k-means assumes clusters are spherical blobs and forces every point into some cluster. DBSCAN[1] drops both assumptions: it defines clusters as density-connected regions, picks up clusters of arbitrary shape, and flags low-density points as noise. It is the right tool when you do not know in advance and clusters might be curved or interlaced.
Density-based concepts
Three definitions, parameterized by a radius and a minimum
neighbor count minPts:
- Core point: has at least
minPtsother points within . - Border point: has fewer than
minPtsneighbors but lies within of some core point. - Noise point: neither core nor border.
A core point is density-reachable from any other core point through a chain of overlapping -neighborhoods. A cluster is a maximal set of density-reachable points (core + border)[1].
The algorithm
- Mark all points unvisited.
- Pick an unvisited point . If it is a core point, start a new cluster: add and recursively add every density-reachable point from . Otherwise mark as noise (it may later be reassigned to a cluster as a border point).
- Repeat until all points are visited.
The result is a set of clusters of arbitrary shape, plus a noise pile. The number of clusters is determined by the data, not specified up front.
Strengths
- Arbitrary cluster shapes: works on rings, half-moons, blobs, anything density-connected.
- No needed: the data decides.
- Noise tolerance: outliers are flagged, not crammed into clusters.
- Deterministic: same data and same /
minPtsgive the same clusters (modulo border-point assignment order).
Picking the hyperparameters
minPts is usually set to or where is the dimension; it
controls the minimum cluster size.
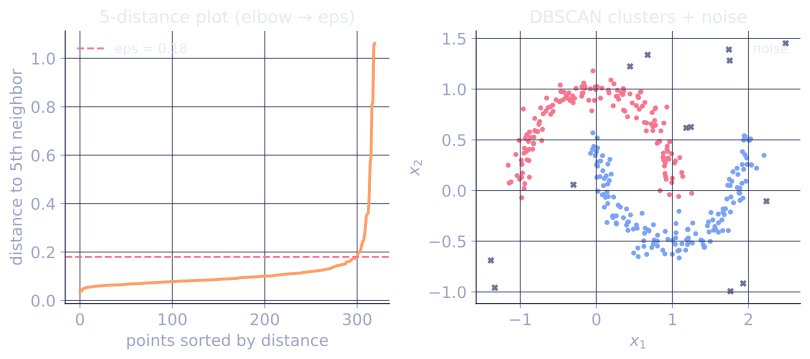
is the harder one. Standard heuristic: plot the k-distance,
the distance to each point's minPts-th nearest neighbor, sorted in
ascending order. Look for a knee. Points to the left of the knee are
core-eligible at the corresponding ; points past the knee are
noise-eligible.
The k-distance plot gives a defensible choice without trial and error.
Limits
- Varying density: a single either makes the dense clusters bleed together or misses the sparse ones. HDBSCAN (next lesson) fixes this.
- High dimensions: the curse of dimensionality (C4 lesson) makes density estimation unreliable[2].
- Border point ambiguity: a border point can be reached from multiple clusters; assignment depends on visit order. Usually a minor effect.
Check it on arrays
import numpy as np

rng = np.random.default_rng(0)

# Two interlocked half-moons + noise points
def make_moons(n_per=100, noise=0.1, rng=rng):
    t = np.linspace(0, np.pi, n_per)
    x1 = np.column_stack([np.cos(t), np.sin(t)])
    x2 = np.column_stack([1 - np.cos(t), 1 - np.sin(t) - 0.5])
    return np.vstack([x1, x2]) + noise * rng.normal(size=(2 * n_per, 2))

X_moons = make_moons(n_per=120)
X_noise = rng.uniform(-1.5, 2.5, size=(20, 2))
X = np.vstack([X_moons, X_noise])

def dbscan(X, eps, min_pts):
    n = len(X)
    labels = np.full(n, -1)                            # -1 = noise / unassigned
    visited = np.zeros(n, dtype=bool)
    D = np.linalg.norm(X[:, None] - X[None, :], axis=2)
    cluster_id = 0
    for i in range(n):
        if visited[i]: continue
        visited[i] = True
        neighbors = list(np.where(D[i] <= eps)[0])
        if len(neighbors) < min_pts:
            continue                                    # noise (provisionally)
        labels[i] = cluster_id
        seeds = list(neighbors)
        while seeds:
            j = seeds.pop()
            if not visited[j]:
                visited[j] = True
                nj = list(np.where(D[j] <= eps)[0])
                if len(nj) >= min_pts:
                    seeds.extend(nj)
            if labels[j] == -1:
                labels[j] = cluster_id
        cluster_id += 1
    return labels

labels = dbscan(X, eps=0.25, min_pts=5)
print(f"clusters found: {len(set(labels)) - (1 if -1 in labels else 0)}")
print(f"noise points: {(labels == -1).sum()} / {len(X)}")
for c in sorted(set(labels)):
    print(f"  label {c}: {int((labels == c).sum())} points")

# k-distance plot heuristic
k = 5
kdist = np.sort([np.partition(np.linalg.norm(X - x, axis=1), k)[k] for x in X])
print(f"\nk-distance percentiles for k={k}: 50%={np.percentile(kdist, 50):.3f}, 90%={np.percentile(kdist, 90):.3f}")
print("eps ~ knee of k-distance plot (around the percentile where the curve bends up)")
DBSCAN separates the two moons and labels the random points as noise; the k-distance plot suggests a reasonable .
Exercises
Exercise 1. Five points lie on a line at positions . With
and minPts (counting the point itself), classify each
point as core, border, or noise.
Solution
Step 1. Count, for each point, how many points (including itself) fall within distance . Point : itself and , so 2. Point : , so 3. Point : itself and , so 2. Point : itself and , so 2. Point : itself and , so 2.
Step 2. A point is core when its neighbor count is at least minPts .
Only point qualifies, so is the lone core point.
Step 3. Border points have fewer than minPts neighbors but lie within
of a core point. Points and are within of the core
, so both are border. Points and are far from any core point, so
both are noise. The cluster is ; is noise.
Exercise 2. Explain why raising minPts while holding fixed
can only turn core points into non-core points (never the reverse), and what
effect this has on the amount of data flagged as noise.
Solution
Step 1. Whether a point is core depends on the test "neighbor count within
is at least minPts". The neighbor count is fixed once
is fixed; only the threshold minPts changes.
Step 2. Raising the threshold can only make the inequality harder to satisfy. A point that failed before still fails; a point that passed before may now fail if its count sits between the old and new threshold. No point that failed can start passing, so the set of core points shrinks (weakly).
Step 3. Fewer core points means fewer seeds to grow clusters and fewer
points reachable from a core, so more points end up neither core nor border.
Raising minPts therefore increases the fraction of data labeled noise.
Exercise 3 (code). On one dense blob plus scattered uniform noise, run DBSCAN and verify it recovers a single cluster while flagging most of the scattered points as noise.
Solution
import numpy as np

rng = np.random.default_rng(0)
blob = rng.normal(loc=[0.0, 0.0], scale=0.3, size=(150, 2))
noise = rng.uniform(-5, 5, size=(30, 2))           # spread far from the blob
X = np.vstack([blob, noise])

def dbscan(X, eps, min_pts):
    n = len(X)
    labels = np.full(n, -1)
    visited = np.zeros(n, dtype=bool)
    D = np.linalg.norm(X[:, None] - X[None, :], axis=2)
    cid = 0
    for i in range(n):
        if visited[i]:
            continue
        visited[i] = True
        nb = list(np.where(D[i] <= eps)[0])
        if len(nb) < min_pts:
            continue
        labels[i] = cid
        seeds = list(nb)
        while seeds:
            j = seeds.pop()
            if not visited[j]:
                visited[j] = True
                nj = list(np.where(D[j] <= eps)[0])
                if len(nj) >= min_pts:
                    seeds.extend(nj)
            if labels[j] == -1:
                labels[j] = cid
        cid += 1
    return labels

labels = dbscan(X, eps=0.4, min_pts=5)
n_clusters = len(set(labels) - {-1})
n_noise = int((labels == -1).sum())

assert n_clusters == 1                              # the dense blob is one cluster
assert n_noise >= 20                                # most scattered points are noise
print("clusters:", n_clusters, " noise points:", n_noise)
DBSCAN grows a single cluster out of the dense blob and rejects the scattered uniform points, the behavior that lets it separate signal from noise without a preset cluster count.
The next lesson handles the varying-density case where one is not enough: HDBSCAN.
References
- [1]Ester, M., Kriegel, H.-P., Sander, J., & Xu, X. (1996). "A density-based algorithm for discovering clusters in large spatial databases with noise". KDD. The original DBSCAN, core/border/noise points, and the k-distance heuristic for .↩
- [2]Hastie, T., Tibshirani, R., & Friedman, J. (2009). The Elements of Statistical Learning (2nd ed.). Springer. doi:10.1007/978-0-387-84858-7.↩