 AI Knowledge Tree
Statistical anomaly detection
Flag points beyond IQR, ESD, or CUSUM thresholds, the simplest and most defensible AD baselines.
The simplest anomaly detectors are statistical thresholds: flag any point that sits far from where the distribution says it should. IQR and ESD test single observations against a fitted distribution; CUSUM detects when a sequence of observations starts drifting[1]. These methods have one huge advantage over more complex AD: they come with calibrated false-alarm rates.
Tukey's IQR rule
Compute the interquartile range . Flag any point outside the fences
For a normal distribution this catches roughly 0.7% of points (a 99.3% confidence interval). The constant 1.5 is conventional; 3 is sometimes used to flag only extreme outliers. The rule is nonparametric: it does not assume Gaussianity, just that the bulk of the data is well-summarized by its quartiles.
Z-score and modified Z-score
For roughly normal data:
The fraction of normally-distributed points beyond 3 standard deviations is ~0.27%, giving a controlled false-alarm rate. The catch: and are themselves contaminated by the outliers you want to find, so a few large outliers can mask each other (masking effect).
Modified Z-score uses median and MAD (median absolute deviation), which are robust to outliers:
The 0.6745 makes the modified Z-score consistent with the standard for normal data. Threshold at .
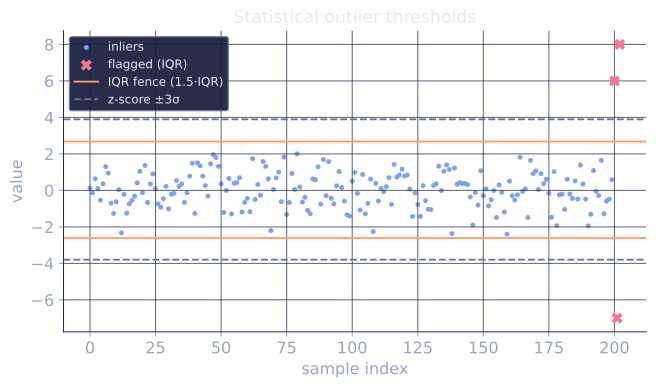
These two scores are routinely conflated, but they diverge whenever outliers are present, because they estimate scale differently. On the closing block's 200 clean draws plus three planted outliers at , the three big values inflate the standard deviation to , while the MAD-implied scale stays near the true . The point then reads as under the contaminated but under the robust scale: the outlier looks less extreme to the plain Z-score because it has corrupted its own yardstick. With enough large outliers this gap pushes a true anomaly back under the threshold (the masking effect); the robust estimator does not move, so it keeps flagging it.
Generalized ESD (Rosner's test)
Iterative procedure that explicitly tests for up to outliers in a normal sample:
- Compute the most extreme residual on the current data.
- Compare to a critical value from the Student-t distribution.
- If , remove the point and repeat. Otherwise stop.
ESD handles masking better than a single Z-score by removing detected outliers and recomputing the mean/std at each round.
CUSUM for change detection
For a sequence of observations, CUSUM (cumulative sum) tracks how far the running sum has drifted from the baseline. Define
with target mean and slack . Raise an alarm when exceeds a threshold . Calibrated for given , CUSUM has a known average run length between false alarms, making it useful for quality control and time-series monitoring.
When statistical AD is the right tool
- One-dimensional or low-dimensional continuous data.
- Need calibrated false-alarm rates (regulated industries, safety monitoring).
- As a fast baseline before reaching for complicated AD.
Limits
- One-dimensional methods can miss multivariate anomalies (a point with every feature individually normal but jointly impossible). Multivariate extensions (Mahalanobis distance to fitted Gaussian) work for low ; beyond that, the next lessons cover scalable methods.
- Assume the bulk distribution is stationary. Drift over time breaks the threshold.
Check it on arrays
import numpy as np

rng = np.random.default_rng(0)

# Mostly normal with a few outliers
x = np.concatenate([rng.normal(loc=0, scale=1, size=200),
                    np.array([6.0, -7.0, 8.0])])           # 3 outliers
true_outlier_idx = np.array([200, 201, 202])

# IQR rule
q1, q3 = np.percentile(x, [25, 75])
iqr = q3 - q1
mask_iqr = (x < q1 - 1.5 * iqr) | (x > q3 + 1.5 * iqr)
print(f"IQR rule: flagged {mask_iqr.sum()} (true outliers in flagged: {mask_iqr[true_outlier_idx].sum()})")

# Z-score (sensitive to masking)
z = (x - x.mean()) / x.std()
mask_z = np.abs(z) > 3
print(f"Z-score: flagged {mask_z.sum()} (true in flagged: {mask_z[true_outlier_idx].sum()})")

# Modified Z-score (robust)
med = np.median(x)
mad = np.median(np.abs(x - med))
z_mod = 0.6745 * (x - med) / mad
mask_modz = np.abs(z_mod) > 3.5
print(f"Modified Z: flagged {mask_modz.sum()} (true in flagged: {mask_modz[true_outlier_idx].sum()})")

# CUSUM on a sequence with a level shift in the middle
n = 200
seq = np.concatenate([rng.normal(0, 1, n), rng.normal(0.5, 1, n)])  # mean shifts at t=200
mu, k_slack, h = 0.0, 0.3, 5.0
S_plus = np.zeros(len(seq))
for t in range(1, len(seq)):
    S_plus[t] = max(0, S_plus[t-1] + (seq[t] - mu) - k_slack)
alarm = np.argmax(S_plus > h) if np.any(S_plus > h) else None
print(f"\nCUSUM alarm at t={alarm} (true shift at t=200)")
The IQR and modified Z-score correctly find the planted outliers; the plain Z-score is partially masked by the outliers themselves; CUSUM detects the level shift in the synthetic sequence.
Exercises
Exercise 1. A small clean sample has quartiles and . Compute Tukey's fences and decide whether the observations and are flagged.
Solution
Step 1. The interquartile range is .
Step 2. The fence half-width is , so the fences are
Step 3. Compare each point to the interval . The value is below the lower fence , so it is flagged. The value lies inside the interval, so it is not flagged.
Exercise 2. A standard Z-score flags a point when . Show that for a single observation in a sample of points, can never exceed , and conclude that with no point is ever flagged at the rule.
Solution
Step 1. Write with (the sample variance with in the denominator). One single squared deviation cannot exceed the whole sum, so .
Step 2. Divide both sides by and take the square root:
Step 3. For the bound gives , so no point can satisfy . The Z-score rule is structurally blind to outliers in tiny samples: the same outlier that inflates caps how large its own score can be. This is the masking effect in its sharpest form.
Exercise 3 (code). Take 200 clean draws from and inject identical outliers at value . Show that as grows the plain Z-score becomes fully masked (flags none of the planted points), while the MAD-based modified Z-score keeps flagging every one.
Solution
import numpy as np

def flag_modified_z(x, thresh=3.5):
    med = np.median(x)
    mad = np.median(np.abs(x - med))
    z = 0.6745 * (x - med) / mad
    return np.abs(z) > thresh

rng = np.random.default_rng(0)
clean = rng.normal(0, 1, size=200)

# Inject k identical large outliers at value 6 and compare the two scores
for k in [5, 20]:
    x = np.concatenate([clean, np.full(k, 6.0)])
    out_idx = np.arange(200, 200 + k)
    z = (x - x.mean()) / x.std()
    plain = int((np.abs(z) > 3)[out_idx].sum())
    robust = int(flag_modified_z(x)[out_idx].sum())
    print(f"k={k:2d}: plain z flags {plain}/{k} (s={x.std():.3f}), modified z flags {robust}/{k}")

# At k = 20 the plain z-score is fully masked: it flags none of them.
x20 = np.concatenate([clean, np.full(20, 6.0)])
out20 = np.arange(200, 220)
z20 = (x20 - x20.mean()) / x20.std()
assert (np.abs(z20) > 3)[out20].sum() == 0
# The robust modified z-score flags every planted outlier at both levels.
assert flag_modified_z(x20)[out20].all()
print("plain z fully masked at k=20; robust z flags all 20")
At both rules flag all five planted points, but the inflated standard deviation ( at ) pushes the plain Z-score of value under , so it flags . The median and MAD do not move with the contamination, so the modified Z-score flags all .
The next lesson generalizes to high dimensions with Isolation Forest.
References
- [1]Chandola, V., Banerjee, A., & Kumar, V. (2009). "Anomaly detection: a survey". ACM Computing Surveys, 41(3), 1-58. doi:10.1145/1541880.1541882. Surveys statistical, distance, and classification-based detectors with their false-alarm trade-offs.↩